Impact of Kameleoon on your website's performance
You can use various performance analysis tools to evaluate your site’s efficiency. Consult Kameleoon's guidelines below to identify and implement necessary improvements based on your results.
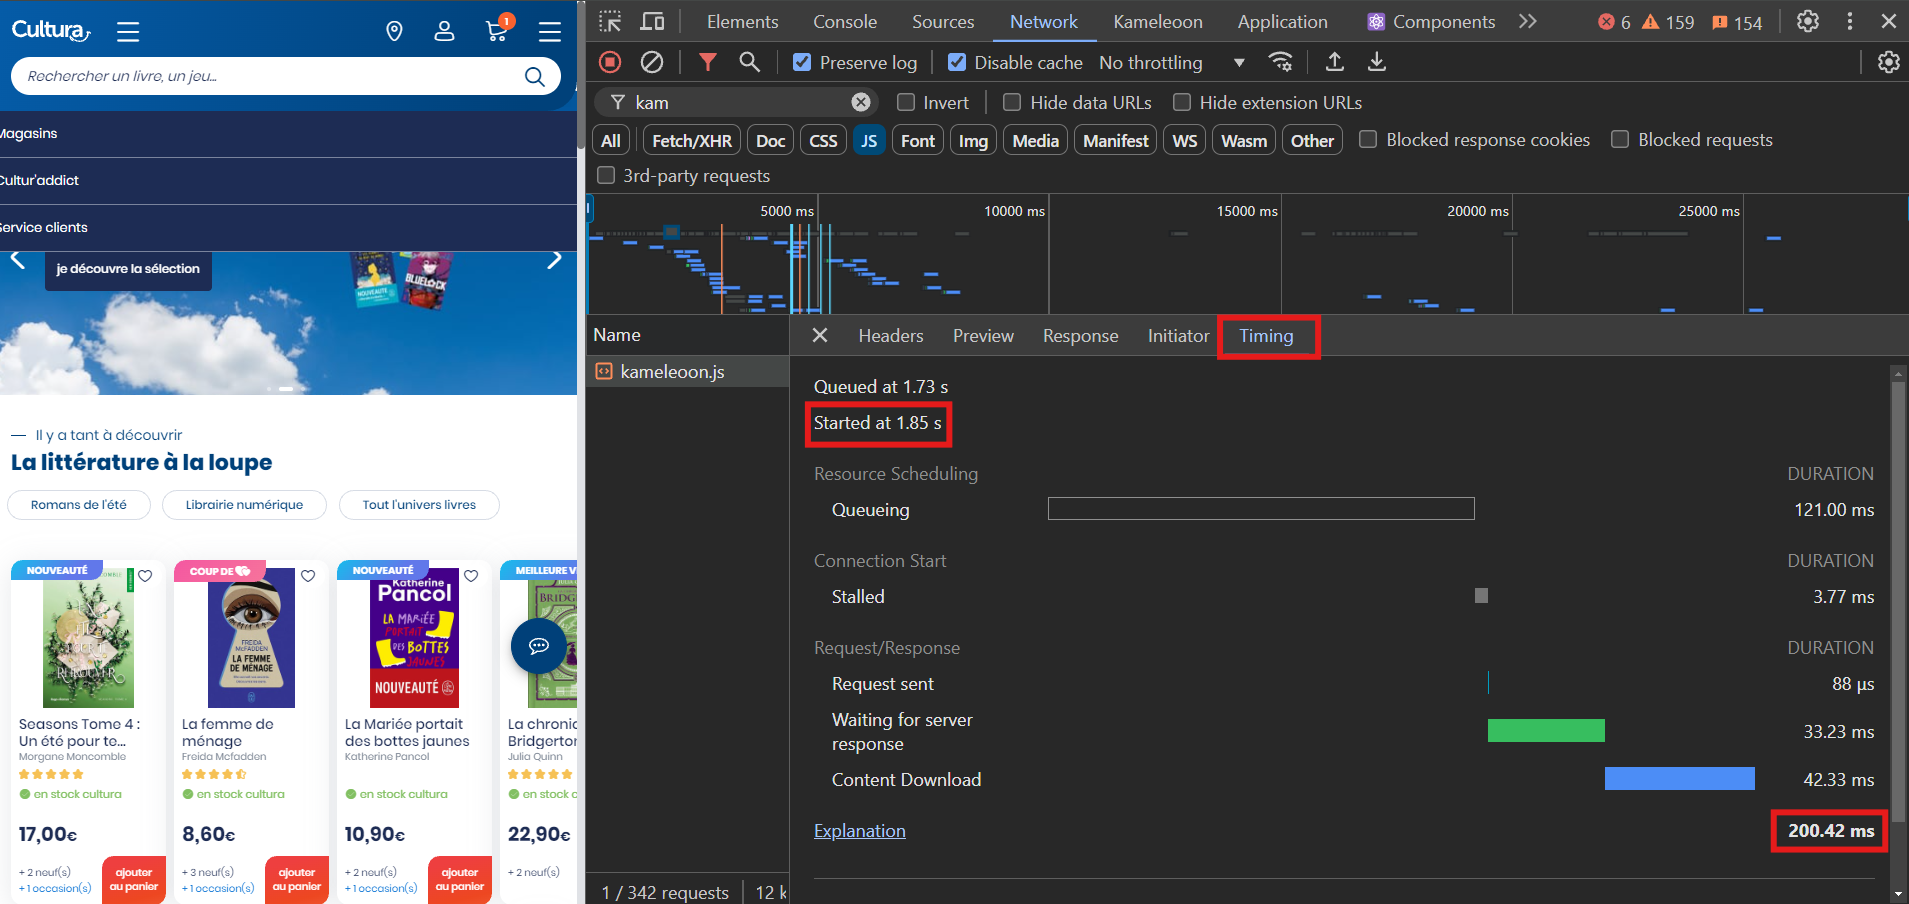
Checking when the snippet loads
Check the timing of the engine.js (previously called kameleoon.js) tag after the page reload, as shown in the screenshot below. If the started at metric is above 1 second, enter the Kameleoon script higher in the <head> tag and set fetchpriority="high". These changes ensure the Kameleoon script loads in less than 1 second.
When the page first loads, the Kameleoon script takes longer, usually under 60 milliseconds, as it is downloaded directly from the CDN. During subsequent reloads, the script is downloaded from cache.
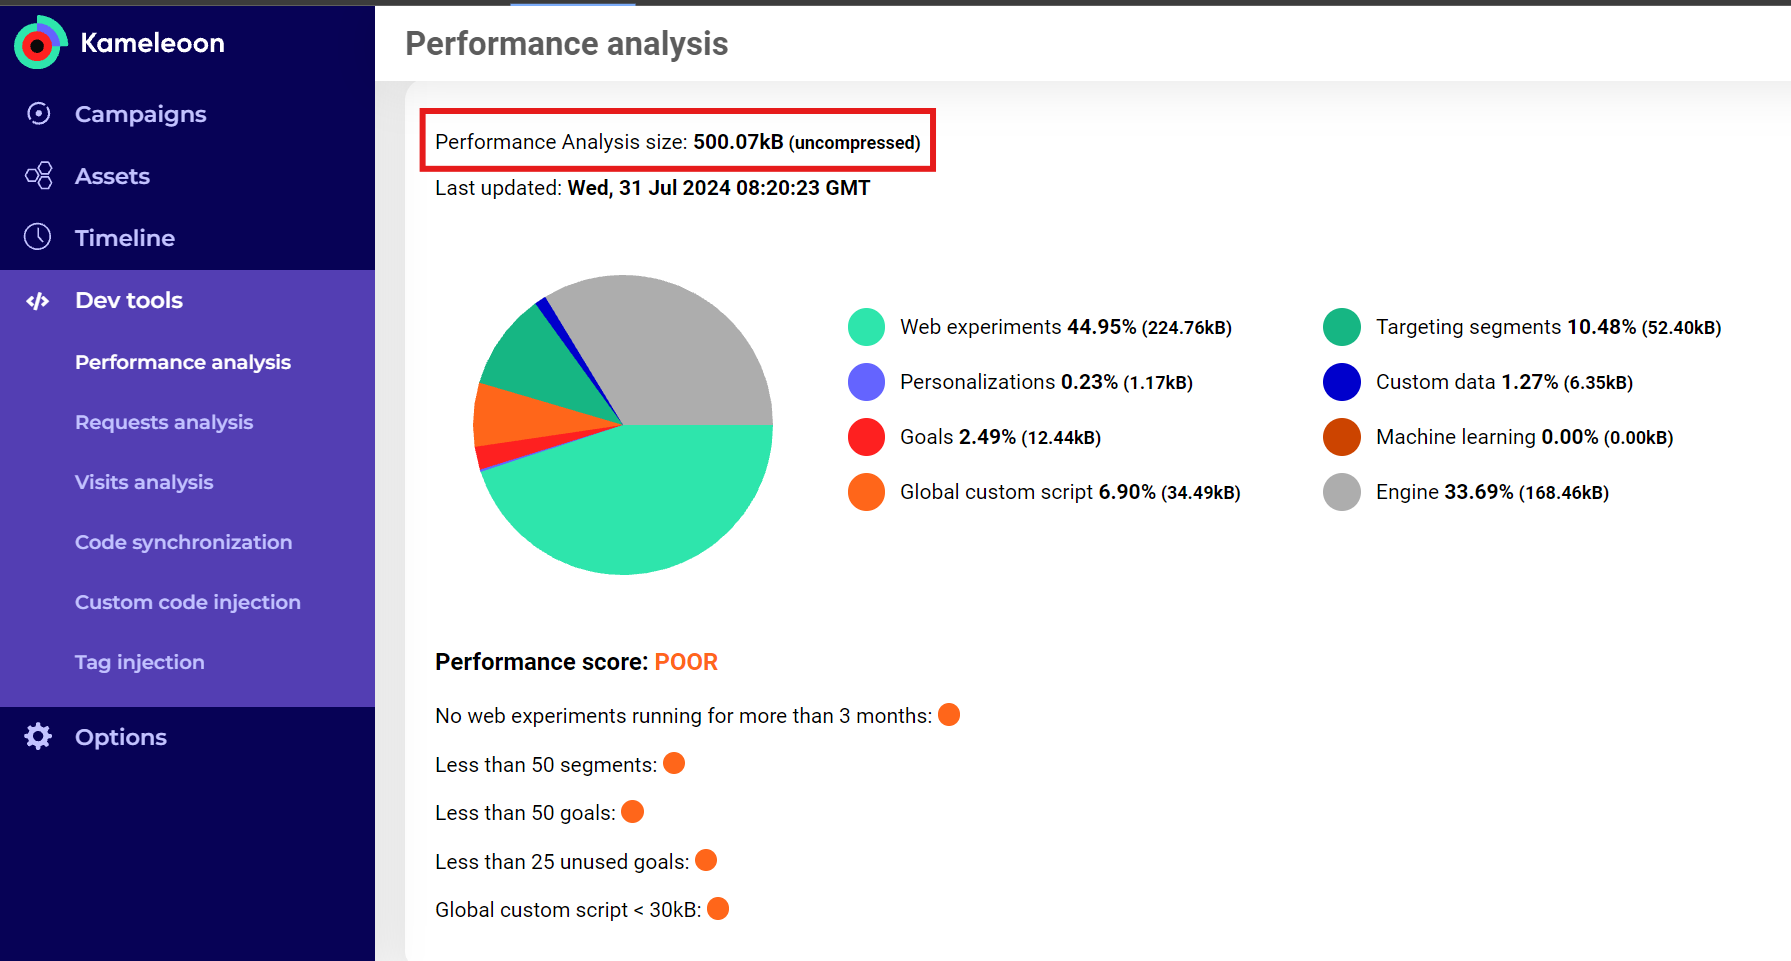
Checking performance score, powered by Kameleoon's Chrome Extension
Depending on the Performance score shown in the extension (see screenshot below), take one or all of these actions:
- Stop any experiments or personalizations that have been running for more than 2 months and transfer the code to your site’s source code based on the experiment or personalization result.
- Archive any experiments or personalizations that have been stopped.
- Remove any unused goals, including their code if they are custom goals.
- Remove any unused segments.
- Remove any unused custom data.
- Optimize the Global Custom Script to remove all unused/deprecated code.
For details, refer to this article for help with the Kameleoon Debug Assistant extension.
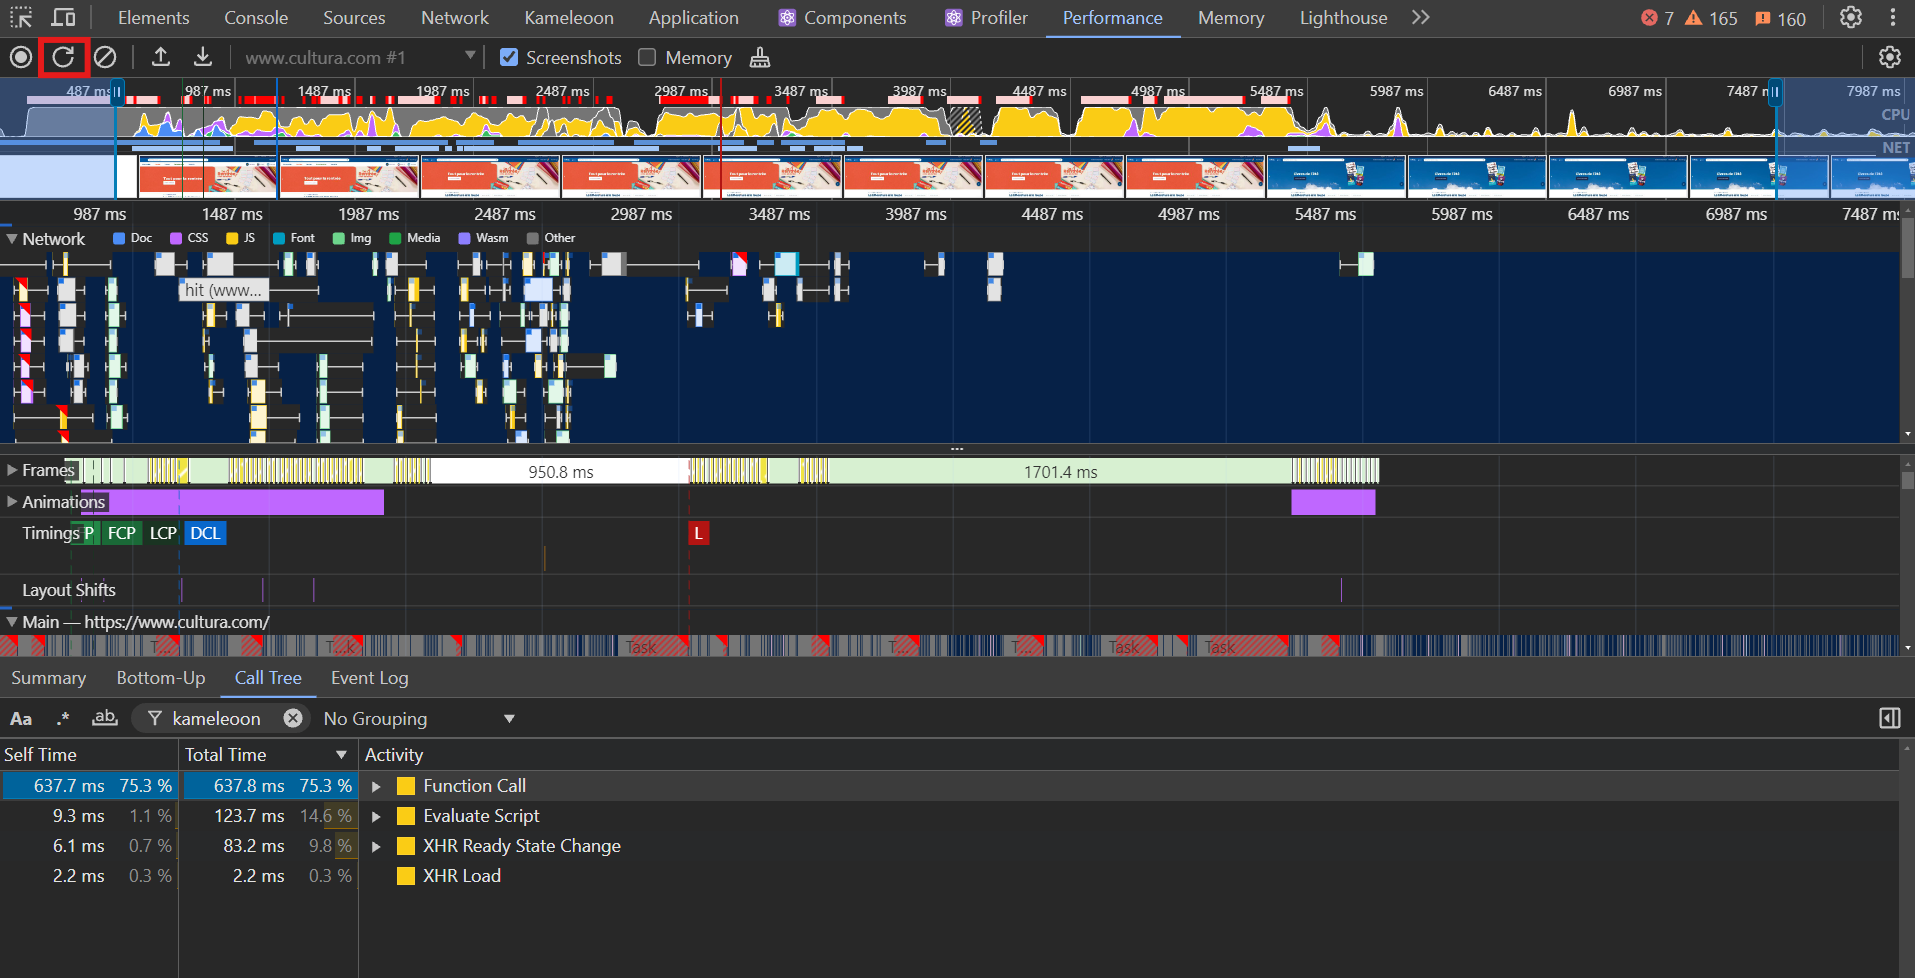
Tracking performance with PageSpeed insights
The Performance tab in the browser's developer tools helps analyze how a web page performs by recording and visualizing key data such as page load times, memory usage, and resource consumption. It provides detailed insights into rendering, scripting, and layout processes in the form of timelines and flame charts. This can help identify bottlenecks, slow-loading scripts, and other factors impacting speed.
Google PageSpeed Insights analyzes the content of a webpage and provides performance insights and suggestions for improvements. It gives a score and suggestions based on Core Web Vitals, such as loading time, interactivity, and visual stability. The results are displayed in a report format with metrics like "FCP," "LCP," "INP," and "CLS."
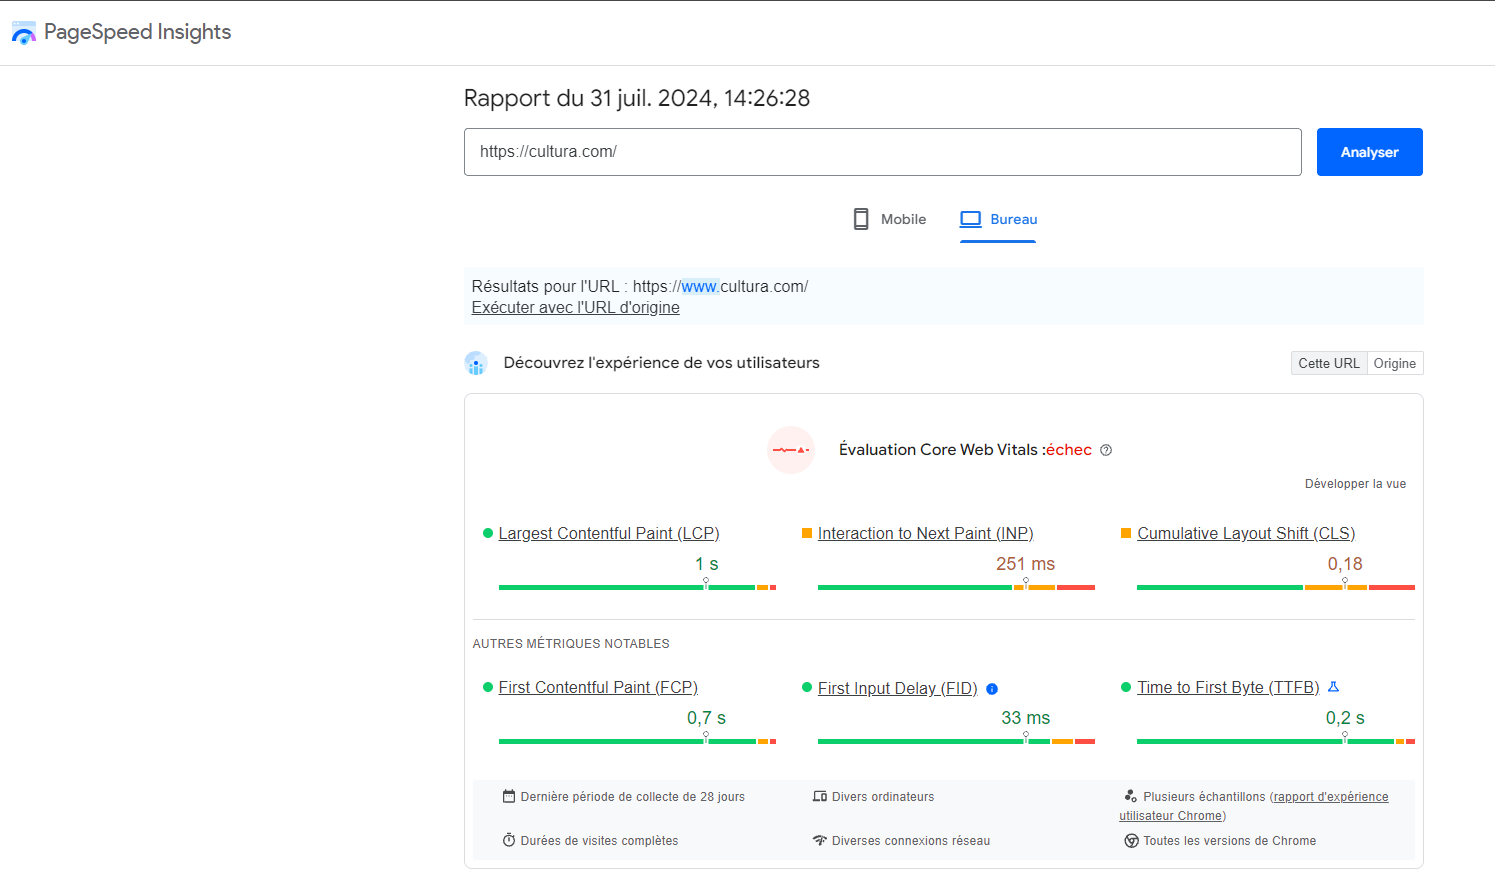
First Contentful Paint
First Contentful Paint (FCP) measures the time between the start of page loading and when page content is displayed on the screen.
- Possible impact: Anti-flicker could impact the FCP since it delays the first element display on the page
- Action: Lower the timeout of the anti-flicker from 1000 milliseconds to 500 milliseconds or remove the anti-flicker script if Kameleoon loads very early (started at ≃ 500 milliseconds). The following example code snippet demonstrates how to achieve this:
var kameleoonLoadingTimeout = 1000;
Largest Contentful Paint
Largest Contentful Paint (LCP) measures perceived loading speed. It marks the point in the page load timeline when the main content of the page has likely loaded.
- Possible impact: Anti-flicker could have an impact on the LCP since it delays the display of the largest element on the page
- Action: The same as for the FCP above.
Interaction to Next Paint
Interaction to Next Paint (INP) measures the page's responsiveness. To provide a positive user experience, strive to have an INP of less than 200 milliseconds.
- Possible impact: If Kameleoon loads early, there should be no negative impact. However, tests that change the behavior of an interaction might affect this metric.
- Action: You can use Kameleoon Chrome Extension or the code below in the console to check what are the experiments / personalizations that are active on the concerned page to find the possible source of the impact. The following example code snippet demonstrates how to achieve this:
Kameleoon.API.Experiments.getActive()
Kameleoon.API.Personalizations.getActive()
Cumulative Layout Shift
Cumulative Layout Shift (CLS) measures an element's largest change of position during the page's lifecycle. Note that layout shifts only occur when existing elements change their starting position. If a new element is added to the DOM, or if an existing element changes size, this does not count as a layout change, as long as the change does not result in a change to the starting position of other visible elements.
- Possible impact: The Kameleoon tag has no impact on this index. experiments / personalizations on the other hand, can have a negative impact if they cause a change in the starting position of an element.
- Action: The same as for the INP above.
Speed Index (ContentSquare metric)
Speed Index measures the time when the majority of graphic elements above the waterline are displayed.
- Possible impact: Anti-flicker could impact the Speed Index since it may delay the display of the elements above the waterline. Also, if you run experiments/personalizations that make changes to the top of the page, the Speed Index will be negatively impacted (it will increase).
- Actions: The same as for the FCP and INP above.
Kameleoon script characteristics at a glance
- Asynchronous Snippet: Kameleoon loads its script asynchronously from a reliable CDN (Cloudflare) to ensure a non-blocking first page load and utilizes browser caching for faster subsequent page loads. Kameleoon upholds a Service Level Agreement (SLA) of over 99.99%.
Ensure you have the async attribute in Kameleoon script installed on your site. Please refer to the snippet below:
<script src="[//SITE_CODE.kameleoon.eu/engine.js](https://v0eikkqi7f.kameleoon.eu/engine.js)" **async="true"** fetchpriority="high”></script>
- Low script size: Kameleoon's application file, created using TypeScript, has a size of just 29 KB (compressed with Brotli), which minimizes loading time on the first page.
- Preprocessing approach: The Kameleoon script is generated only from the components necessary for your specific setup, based on the features and options you are using.
- Unique anti-flickering engine: Kameleoon's engine captures DOM events in real-time and alters the display of components involved in an experiment variation before they are fully rendered.
- Reduced network calls: Kameleoon groups multiple tracking events into a single beacon call, significantly decreasing the total number of network calls required.
- Single script load: Unlike other platforms that require multiple files, Kameleoon loads a single consolidated script, which reduces the number of HTTP requests.
- Deferred experiment loading: Kameleeon allows you to select which experiments to include in the application file,
engine.js(previously calledkameleoon.js) at the time of the initial page load, on a case-by-case basis, and defer non-essential experiments after the first load. - Real time update: To provide more frequent updates without being hindered by browser caching, Kameleoon's Live Update Experiments feature refreshes any experiment labeled “LIVE-UPDATE” within a minute.
Best practices for long-term performance
Beyond analyzing performance, following Kameleoon’s best practices is recommended to ensure sustainable and scalable experiments: