Retrieving experiment results using the Automation API
This tutorial describes how to request experiment results and determine winning variations using the Automation API. It follows previous tutorials on creating experiments, modifying variations, associating goals and segments, and launching experiments.
Requirements
access_token
The Automation API requires an access token. Retrieve the token programmatically by following the instructions in the Obtaining an access token section.
Goal
The tutorial uses the following example experiment:
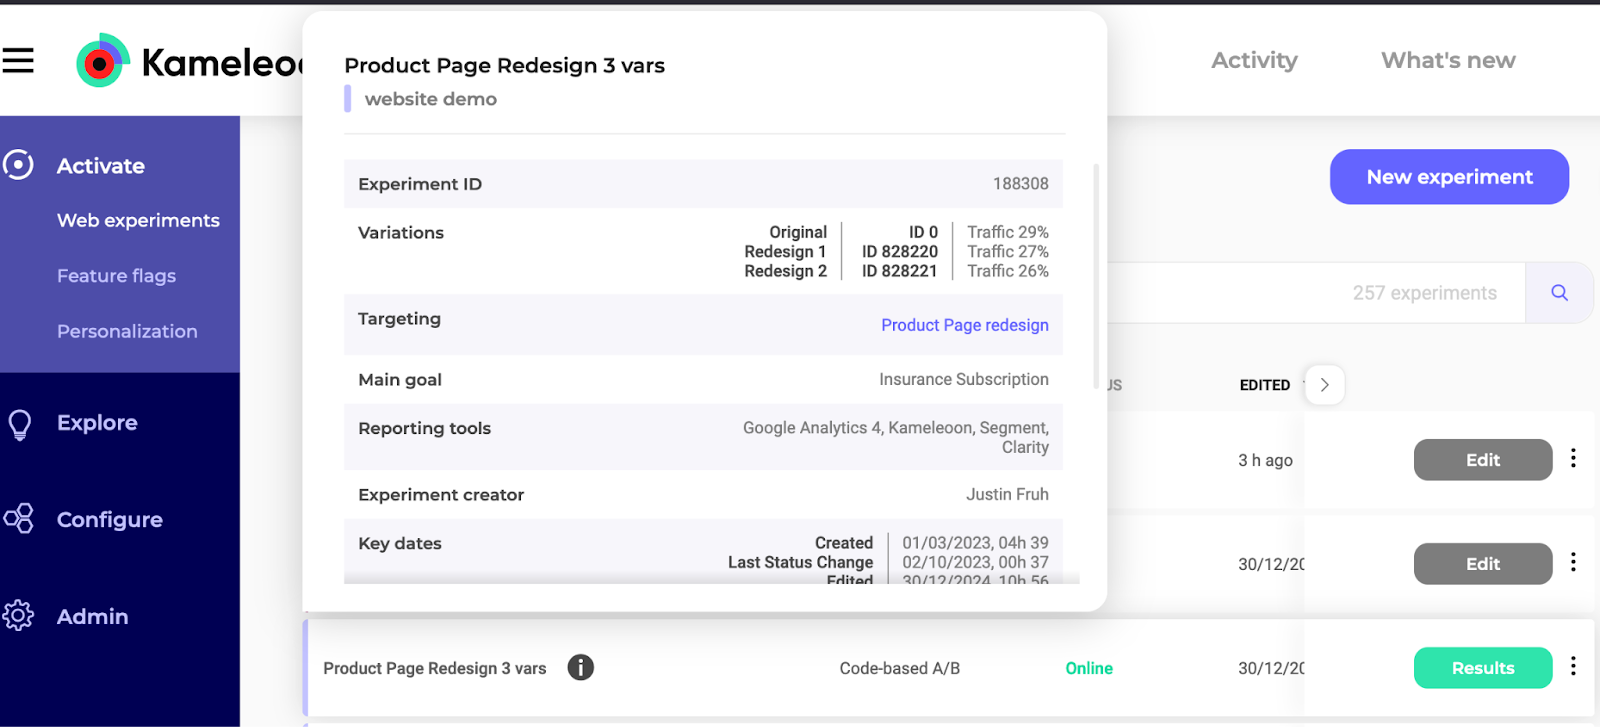
This experiment, called Product Page Redesign, includes two variations in addition to the original version: Redesign 1 (ID 828220) and Redesign 2 (ID 828221). While the experiment has several objectives, this tutorial will focus solely on the main goal, which is to track insurance subscriptions through Click Tracking.
This guide describes how to retrieve and interpret experiment results and apply filters.
The tutorial also applies to Feature Flag experiments; however, use the https://api.kameleoon.com/feature-flags/* endpoints instead of https://api.kameleoon.com/experiments/*:
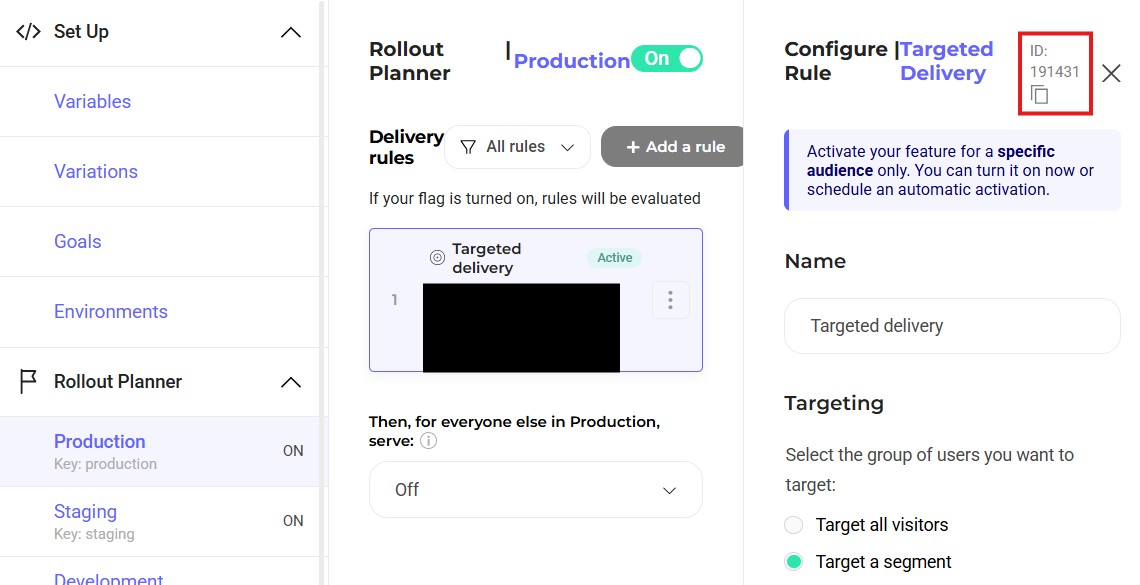
The experimentId is in the Rollout Planner:
1. Retrieve the data code
Case 1: Retrieve results directly
Endpoint:
Retrieve experiment results by sending a POST request to the Request experiment's result endpoint.
| Name | Type | Description |
|---|---|---|
experimentId | String | Mandatory field in the request header. |
goalId | Array | Provide the specific goal ID for identifying main goal results. |
referenceVariationId | Object | Reference variation ID for comparison. |
sequentialTesting | String | Set to true to use sequential testing for determining confidence intervals. |
visitorData | String | Set to false to retrieve data based on visits. Set to true for data based on visitors. |
Example:
curl -L -X POST 'https://api.kameleoon.com/experiments/188308/results' \
-H 'Content-Type: application/json' \
-H 'Accept: */*' \
-H 'Authorization: Bearer <ACCESS_TOKEN>' \
--data-raw '{
  "visitorData": false,
  "sequentialTesting": true,
  "referenceVariationId": "0",
  "goalsIds": [
 279599
  ]
}'
Case 2: Share results without authorization
1. Retrieve a SharedToken
Endpoint:
Share results with unauthorized users by fetching a SharedToken from the Share experiment results endpoint.
curl -L -X POST 'https://api.kameleoon.com/experiments/188308/results/share' \
-H 'Content-Type: application/json' \
-H 'Accept: */*' \
-H 'Authorization: Bearer <ACCESS_TOKEN>' \
--data-raw '{
  "visitorData": false,
  "sequentialTesting": true,
  "referenceVariationId": "0",
  "goalsIds": [
 279599
  ]
}'
Response:
{
    "method": "POST",
    "url": "https://api.kameleoon.com/experiments/188308/results",
    "path": "/experiments/188308/results",
    "headers": {
        "SharedToken": "eyJhbGciOiJIUzUxMiJ9.eyJleHAiOjE4NDQ5NDI5MTMsInNoYXJlZENvZGUiOiJhZmM1NzRjN2I4MjY4NTY3NzI2YjZhMDRhMTUxMjgyNjA3Zjk1ZGI4YjA1Y2RkZGY1ZDEwM2ExZDg5ZWM0MmZmIn0.oCECNm5mEhgIthc6eejo9BrfB7p8kEIrpoqtNb4JUiHK6nsxWHMvLc4hHYXCg3DgaBlVoKv6eEZHGty9c-VAoA",
        "Content-Type": "application/json"
    },
    "payload": {
        "visitorData": false,
        "sequentialTesting": true,
        "referenceVariationId": "0",
        "goalsIds": [
            279599
        ]
    }
}
1. Retrieve the dataCode with the SharedToken
Retrieve experiment results by sending a POST request to the Request experiment's result endpoint using the SharedToken instead of an access token.
| Name | Type | Description |
|---|---|---|
experimentId | String | Mandatory field in the request header. |
goalId | Array | Provide the specific goal ID for identifying main goal results. |
referenceVariationId | Object | Reference variation ID for comparison. |
sequentialTesting | String | Set to true to use sequential testing for determining confidence intervals. |
visitorData | String | Set to false to retrieve data based on visits. Set to true for data based on visitors. |
Example:
curl -L -X POST 'https://api.kameleoon.com/experiments/188308/results' \
-H 'Content-Type: application/json' \
-H 'Accept: */*' \
-H 'SharedToken: <ACCESS_TOKEN>' \
--data-raw '{
  "visitorData": false,
  "sequentialTesting": true,
  "referenceVariationId": "0",
  "goalsIds": [
 279599
  ]
}'
Response:
{"dataCode":"14443931880924098266207585267983330260134079899081739889989435434342588016765"}
2. Retrieve the experiment results
Endpoint:
After receiving the dataCode, use the result endpoint.
Example:
curl -L -X GET 'https://api.kameleoon.com/results?dataCode=14443931880924098266207585267983330260134079899081739889989435434342588016765'
Response:
{
 "status": "READY",
 "data": {
  "dataCode": "14443931880924098266207585267983330260134079899081739889989435434342588016765",
  "variationData": {
   "_reference": {
    "breakdownData": {
     "_reference": {
      "intervalData": {},
      "generalData": {
       "visitCount": 126862,
       "visitorCount": 0,
       "goalsData": {
        "279599": {
         "conversionCount": 1898,
         "convertedVisitCount": 1898,
         "revenueCount": 235352.0,
         "convertedVisitorCount": 0,
         "revenuePerVisit": 1.86,
         "revenuePerVisitor": 0.0,
         "conversionRate": 0.014961138875313333,
         "averageCart": 124.0,
         "ratioValue": 0.0,
         "outlierBounds": {
          "lower": 0.1,
          "upper": 99.0
         }
        }
       }
      }
     }
    }
   },
   "828220": {
    "breakdownData": {
     "_reference": {
      "intervalData": {},
      "generalData": {
       "visitCount": 167938,
       "visitorCount": 0,
       "goalsData": {
        "279599": {
         "conversionCount": 7826,
         "convertedVisitCount": 7826,
         "revenueCount": 986076.0,
         "convertedVisitorCount": 0,
         "revenuePerVisit": 5.87,
         "revenuePerVisitor": 0.0,
         "reliability": 100.0,
         "improvementRange": {
          "min": 193.92,
          "max": 229.03,
          "half": 17.56
         },
         "improvementRate": 211.48,
         "conversionRate": 0.04660053114840001,
         "averageCart": 126.0,
         "ratioValue": 0.0,
         "continuousMetrics": {
          "conversions": {
           "reliability": 1.0,
           "improvementRate": 2.114771645178252,
           "halfInterval": 0.10445147824911348,
           "lowerBound": 2.0103201669291386,
           "upperBound": 2.219223123427365
          },
          "revenuePerVisit": {
           "reliability": 1.0,
           "improvementRate": 2.1650098975198366,
           "halfInterval": 0.10613617951119597,
           "lowerBound": 2.0588737180086407,
           "upperBound": 2.2711460770310326
          },
          "averageCart": null
         },
         "outlierBounds": {
          "lower": 0.1,
          "upper": 99.0
         }
        }
       }
      }
     }
    }
   },
   "828221": {
    "breakdownData": {
     "_reference": {
      "intervalData": {},
      "generalData": {
       "visitCount": 174194,
       "visitorCount": 0,
       "goalsData": {
        "279599": {
         "conversionCount": 1477,
         "convertedVisitCount": 1477,
         "revenueCount": 189056.0,
         "convertedVisitorCount": 0,
         "revenuePerVisit": 1.09,
         "revenuePerVisitor": 0.0,
         "reliability": 100.0,
         "improvementRange": {
          "min": -47.93,
          "max": -38.72,
          "half": 4.6
         },
         "improvementRate": -43.33,
         "conversionRate": 0.00847905209134643,
         "averageCart": 128.0,
         "ratioValue": 0.0,
         "continuousMetrics": {
          "conversions": {
           "reliability": 1.0,
           "improvementRate": -0.4332615877700786,
           "halfInterval": 0.027369693136479373,
           "lowerBound": -0.46063128090655797,
           "upperBound": -0.40589189463359926
          },
          "revenuePerVisit": {
           "reliability": 1.0,
           "improvementRate": -0.41497970350459723,
           "halfInterval": 0.028252586463462577,
           "lowerBound": -0.4432322899680598,
           "upperBound": -0.38672711704113466
          },
          "averageCart": null
         },
         "outlierBounds": {
          "lower": 0.1,
          "upper": 99.0
         }
        }
       }
      }
     }
    }
   }
  },
  "ventilationNames": null,
  "cupedDataByGoalId": {}
 }
}
3. Interpreting the results to determine the winning variation
Winning variations must demonstrate high reliability (exceeding 95%) and a positive improvement rate compared to the reference variation.
The JSON response shows that both Redesign 1 and Redesign 2 have a 100% reliability rate. However, Redesign 1 has a +211.48% improvement rate compared to the -43.33% rate of Redesign 2. Therefore, Redesign 1 is the winner.
Redesign 1
"828220": {
    "breakdownData": {
     "_reference": {
      "intervalData": {},
      "generalData": {
       "visitCount": 167938,
       "visitorCount": 0,
       "goalsData": {
        "279599": {
         "conversionCount": 7826,
         "convertedVisitCount": 7826,
         "revenueCount": 986076.0,
         "convertedVisitorCount": 0,
         "revenuePerVisit": 5.87,
         "revenuePerVisitor": 0.0,
         "reliability": 100.0,
         "improvementRange": {
          "min": 193.92,
          "max": 229.03,
          "half": 17.56
         },
         "improvementRate": 211.48,
Redesign 2
"828221": {
    "breakdownData": {
     "_reference": {
      "intervalData": {},
      "generalData": {
       "visitCount": 174194,
       "visitorCount": 0,
       "goalsData": {
        "279599": {
         "conversionCount": 1477,
         "convertedVisitCount": 1477,
         "revenueCount": 189056.0,
         "convertedVisitorCount": 0,
         "revenuePerVisit": 1.09,
         "revenuePerVisitor": 0.0,
         "reliability": 100.0,
         "improvementRange": {
          "min": -47.93,
          "max": -38.72,
          "half": 4.6
         },
         "improvementRate": -43.33,
4. Filter experiment results
Obtain specific results by using the breakdown and filter parameters. The breakdown parameter organizes data by factors such as new visitors, operating system, browser, day of the week, SDK, and timezone.
For example, return a browser breakdown for only new visitors by including the breakdown parameter set to BROWSER and a filters parameter set to NEW_VISITOR, based on the direct results procedure. The cURL request to the Export experiment results endpoint should appear as follows:
curl -L -X POST 'https://api.kameleoon.com/experiments/188308/results' \
-H 'Content-Type: application/json' \
-H 'Accept: */*' \
-H 'Authorization: Bearer <ACCESS_TOKEN>
' \
--data-raw '{
  "visitorData": true,
  "sequentialTesting": true,
  "breakdown": {
    "type": "BROWSER"
  },
  "referenceVariationId": "0",
  "filters": [

    {
        "type":"NEW_VISITOR",
        "visitorsType":"NEW_VISITORS",
        "include":true
    }],
  "goalsIds": [
        279599
  ]
}'
After receiving the dataCode, send the following GET request:
curl -L -X GET 'https://api.kameleoon.com/results?dataCode=14443931880924098266207585267983330260134079899081739889989435434342588016765'
A successful request returns experiment results for new visitors using the Chrome browser. The following response is truncated for clarity:
>....
                        }
                    },
                    "OTHERS": {
                        "intervalData": {},
                        "generalData": {
                            "visitCount": 0,
                            "visitorCount": 587206,
                            "goalsData": {
                                "279599": {
                                    "conversionCount": 5410,
                                    "convertedVisitCount": 0,
                                    "revenueCount": 692480.0,
                                    "convertedVisitorCount": 5359,
                                    "revenuePerVisit": 0.0,
                                    "revenuePerVisitor": 1.18,
                                    "reliability": 100.0,
                                    "improvementRange": {
                                        "min": -53.0,
                                        "max": -48.7,
                                        "half": 2.15
                                    },
                                    "improvementRate": -50.85,
                                    "conversionRate": 0.009126269145751235,
                                    "averageCart": 129.22,
                                    "ratioValue": 0.0
                                }
                            }
                        }
                    },
                    "CHROME": {
                        "intervalData": {},
                        "generalData": {
                            "visitCount": 0,
                            "visitorCount": 16,
                            "goalsData": {
                                "279599": {
                                    "conversionCount": 0,
                                    "convertedVisitCount": 0,
                                    "revenueCount": 0.0,
                                    "convertedVisitorCount": 0,
                                    "revenuePerVisit": 0.0,
                                    "revenuePerVisitor": 0.0,
                                    "reliability": 50.0,
                                    "improvementRange": {
                                        "min": null,
                                        "max": null,
                                        "half": null
                                    },
                                    "improvementRate": 0.0,
                                    "averageCart": 0.0,
                                    "ratioValue": 0.0
                                }
                            }
                        }
                    }
                }
            }
        },
        "ventilationNames": null,
        "cupedDataByGoalId": {}
    }
}